Are Roller Coasters Safer Than Cars?
 My family and I recently took a day-trip to a certain amusement park that caters to the chocolate obsessed. I, being a huge roller coaster fan, immediately started gauging my 7 year old’s reaction to the 6 or 7 roller coasters winding throughout the park. The park clearly thinks they are safe enough for her as she is easily tall enough to meet the rigorous “ride height and background safety check” administered by the 16 year old girl running the ride.
Keep in mind that these thoughts of my 7 year old and I, hands in the air, going through loops and cobra inversions together in exhilarating glee were still inside my head. My mouth has not even opened to suggest anything when my wife looks at me, uses her mutant ability to read my thoughts and immediately says “no”.
It’s such a cliché to respond to these concerns with “it’s not as dangerous as riding in a car”, but those were the exact words that crept out of my mouth and leaped off my face. I had no idea if that were true or not. It bugs me when people are confident in a statement when they have no real proof or evidence on the matter, but there I was “mansplaining” to my wife the assured safety of roller coaster commuting.
While I had fun with my family at the park that day, the question ate at me all day. Would it be safer to lay 10 miles of steel track from by bedroom to my work cubicle and ride in a cart through wraparound corkscrews instead of just driving there in my 2006 Toyota Matrix? Are roller coasters safer than cars? I had to get to the bottom of this.
The next day I grabbed a cup of coffee and started using Google-Fu on my keyboard to get an answer to my query. As you may have already guessed I wasn’t able to find any peer reviewed studies on the benefits and cost savings of roller coaster commuting. I was going to have to crack this nut myself. The first task at hand was trying to find a decent measure to compare the two modes of travel. You are only in a coaster for about 2 minutes where the average car commute is closer to a half an hour. My thinking was that hopefully a fair method of comparison would become visible as I found some available data on the subjects.
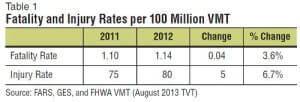
I figured there would be more data on car crashes than roller coaster incidents so I decided to build confidence in my research skills by starting with cars. Luckily the U.S. Department of Transportation published a 2012 report that indicates that there were 80 injuries in 2012 and 75 injuries in 2011 for every 100 million vehicle miles traveled shown if the table below. To give cars the benefit of doubt I’ll use the lower 2011 number. That gives us the very handy statistic of .000075 injuries for every vehicle mile. This was something I could work with.
Next I needed some data on roller coaster injuries. I was immediately discouraged to learn there are no federal regulations on roller coaster safety. Not that I think there is a glaring need for federal agents to descend onto our nations theme parks, but no regulations means it’s unlikely that there would be yearly funding for studies to tell me how many people chip a nail every year riding Space Mountain. However the International Association of Amusement Parks and Attractions commissioned a 2013 study where the National Safety council reported that’s there was 1 roller coaster injury per million patron rides. In other words every time you got on a roller coaster in 2011 you had a .0001% chance of getting injured.
This was great! Not people getting injured in cars and roller coasters, but actually finding some data to compare the two subjects. I now knew that there were roughly .000075 injuries for every mile traveled in a car and that a rider has roughly .0001% chance of getting injured in a roller coaster. So how could I compare these two numbers? My coaster statistic was per ride, and my car statistic was per mile.
Since the question is whether it’s safer to step in to a car or a roller coaster I was going to have to convert my car statistic from mileage to per commute. The only statistic I could find on average one-way commute in miles was from a 2013 US Census release.
In it I found the average commute in the US was 25.5 minutes. Luckily the report also states that 600,000 people travel 90 minutes to go 50 miles. Using that information I can assume that the average commuter can travel .55 miles in a minute which means a 25.5 minute commute is roughly 14.17 miles. I already knew that there are .000075 injuries every mile in a car, multiplying that by the average commute of 14.17 miles meant that there were .0011 injuries per commute. That’s a .11% chance of getting injured stepping into a car versus a .0001% chance of injury getting onto a roller coaster
Well. . . Are Roller Coasters Safer Than Cars?
So besides my wife tuning me out when all this is explained next time we go to an amusement park, what does all this mean? Basically if you accept comparing a roller coaster ride to a car ride you are 1000 times safer getting onto the roller coaster. Now I see an obvious issue with my analysis. The average commute of 14.17 miles is based on rides to a job. Many may argue that the grocery store or grandma’s house is only a mile away.
Others may think since car rides are much longer than coaster rides the whole premise is flawed. So to assuage doubt let’s pretend a commute lasts the 2 minutes that most roller coaster rides last. By again using the .55 miles a minute rate multiplied by the new 2 minute commute we have an average 1.1 mile commute. Multiply that by .000075 injuries per mile and we have .0000825 injuries per commute or a .00825% chance of getting injured in a 2 minute commute.
That still makes the roller coaster 82.5 times safer than a car ride. So while I still feel awful “mansplaining” ride safety to my wife, at least we can all take comfort and relax next time we get onto the Kingda Ka.